Overview
The DC condo/coop market in February continued the trend of being a strong sellers’ market. If you are on the fence about selling, you may want to reconsider. If you’re thinking about buying, be sure to work with an experienced agent who can help you navigate a competitive market.
Inventory Trend
The ups and downs of this chart demonstrates the seasonality of real estate throughout the year. The District has experienced a shortage of inventory for several years, and the pattern continued as two dozen fewer condos hit the market in February 2018 compared to February 2017.
Absorption Rate
You may not be familiar with the absorption rate, but it’s a pretty easy way to figure out if you’re operating in a sellers’ market or a buyers’ market. To calculate the absorption rate, divide the TOTAL ACTIVES by the TOTAL CONTRACTS. In February 2018, the DC condo/coop market’s absorption rate was 1.82. It was just 1.73 during the same time last year.
So what does this mean? If no new condos/coops hit the market after February 2018, all of the inventory would be sold in 1.82 months, or about three weeks into April 2018! A balanced market in DC, which means it’s neither a buyers’ nor sellers’ market, would have an absorption rate of four (4). An absorption rate of 1.82 means it’s a very strong sellers’ market.
The DC Council just made it’s first step towards sweeping changes to DC’s TOPA law. Best known as the First Right of Refusal, TOPA was meant to protect tenants from losing their homes by giving them an opportunity to purchase the property before it is sold to another buyer. However, the law has been exploited by greedy developers and lawyers, who demand Sellers pay them thousands of dollars, or else they’ll hold up the transaction. Not cool at all, and expensive for folks looking to sell their homes.
The DC Council passed two amendments that exclude single family homes from TOPA, while also boosting protections for seniors and persons with disabilities. Check_out this article for more info.
DC's Top 10 Hottest Neighborhoods
These neighborhoods saw the greatest year-over-year increase in median sold prices last year. A few not so surprising places like Congress Heights and Deanwood, but also a rising star in Glover Park.
1. Congress Heights – 36.3%
2. Mass Ave Heights – 29.1%
3. Glover Park – 22.4%
4. Crestwood – 19.4%
5. Deanwood – 16.7%
6. Ledroit Park – 16.4%
7. Randle Heights – 16.2%
8. North Cleveland Park – 14.2%
9. Forest Hills – 13.1%
10. Marchall Heights – 12.6%
*Honorable Mention – Southwest Waterfront, Capitol Hill, Fort Dupont Park, Riggs Park, Lily Ponds
DC’s Top 5 Not-So-Hot Neighborhoods
Unlike the neighborhoods above, these areas experienced a decrease in median sold prices last year when compared to 2016.
1. Barry Farms – -37.1%
2. Wesley Heights - -32.5%
3. Observatory Circle - -17.1%
4. Colonial Village - -13.4%
5. Fort Lincoln - -6.7%
DC Top 10 Sellers Markets
These neighborhoods commanded top dollar, as homes on average sold above list price. Sellers were getting what they wanted, as buyers often found themselves competing with other buyers. Here’s the list of neighborhoods with the highest average sold price (SP) to original list price (OLP) ratio.
1. North Cleveland Park – 104.24%
2. Lily Ponds – 101.39%
3. Burleith – 100.83%
4. American University Park – 100.75%
5. Glover Park – 100.72%
6. Chevy Chase – 100.56%
7. Brookland – 100.42%
8. Mount Pleasant – 100.34%
9. Ledroit Park – 99.76%
10. Crestwood – 99.73%
DC Top 10 Buyers Markets
Unlike the seller’s markets noted above, these neighborhoods were a bit more buyer-friendly. With the average home selling below list price, buyers found themselves in a better position to negotiate.
1. Barry Farms – 93.76%
2. Spring Valley – 94.41%
3. Georgetown – 94.98%
4. Berkley – 95.05%
5. Wesley Heights – 95.7%
DC’s Top 10 Most Expensivest Neighborhoods
You are going to need to open up your wallet to purchase in these neighborhoods, where the median sold price was highest in 2017.
1. Mass Ave Heights - $2.35M
2. Spring Valley - $1.65M
3. Berkley – 1.56M
4. Kent - $1.45M
5. Georgetown - $1.267M
6. Burleith - $1.179M
7. North Cleveland Park - $1.1M
8. Crestwood - $1.075M
9. American University Park - $996k
10. Capitol Hill - $970k
*Honorable Mention – Chevy Chase, Foxhall, Colonial Village, and Shepherd Park
Know Your Neighborhood
Home Inspection Checklist
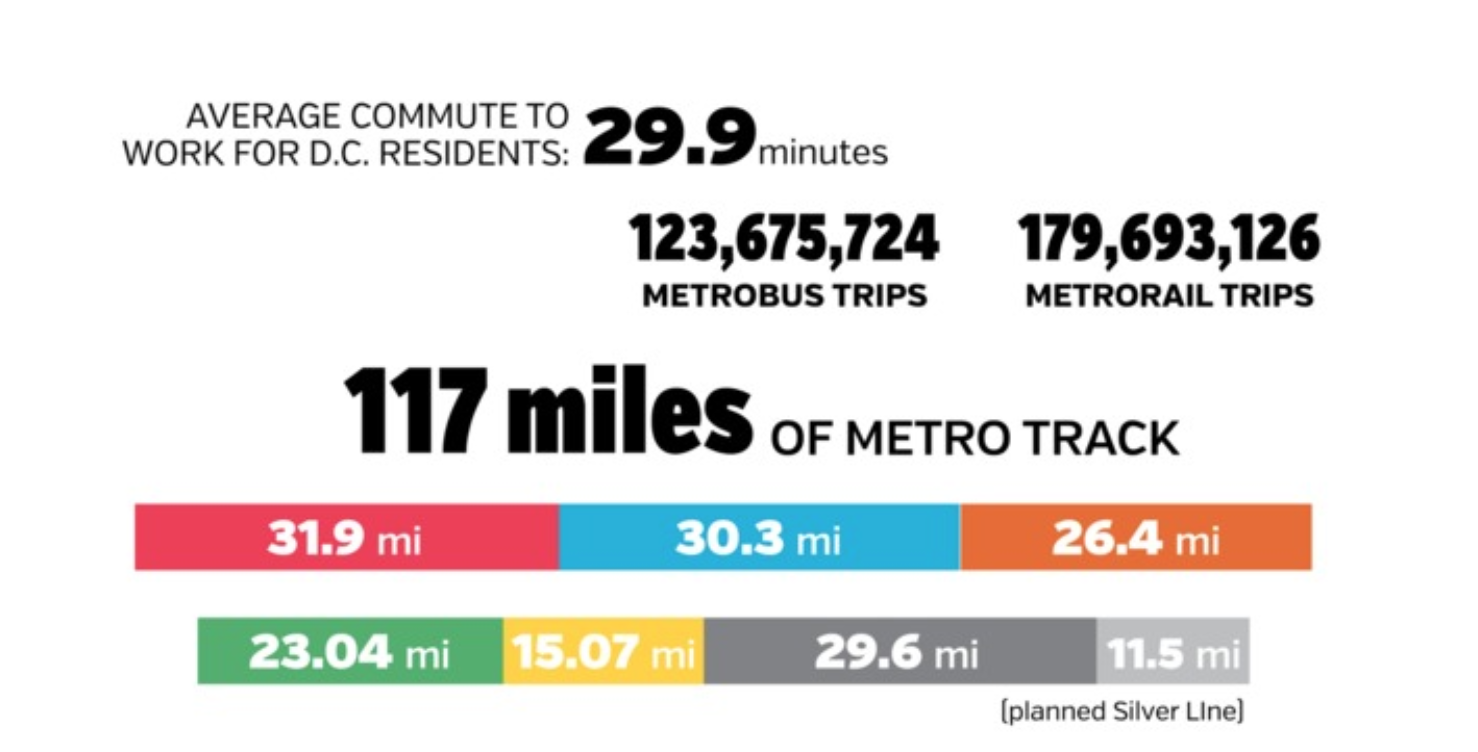
Washington City Paper released it's annual collection of charts, stats, and infographics about life in D.C. This year included some pretty cool graphics that cover topics from the city's population break down to the most popular Smithsonian destinations. Check out the latest District of Data


